
Record sales and see your profit
Once you record both expenses and sales, the app can tell you straight away how much profit (or loss) the shop made this month, what share of sales your ingredients eat up, and which channel brings in the most money.
- For delivery apps, enter the money you actually receive. The app records exactly the number you type and doesn't deduct platform fees. If you enter sales before the platform's commission, your profit will look higher than it is. Use the payout from Grab, Lineman or Shopee Food.
- Using the QR menu? Don't record those orders again. Orders you mark as paid are recorded as income automatically (with a note like “Order #…”). Only record sales that didn't go through the QR menu yourself.
Recording sales
-
Tap + and choose “Income”
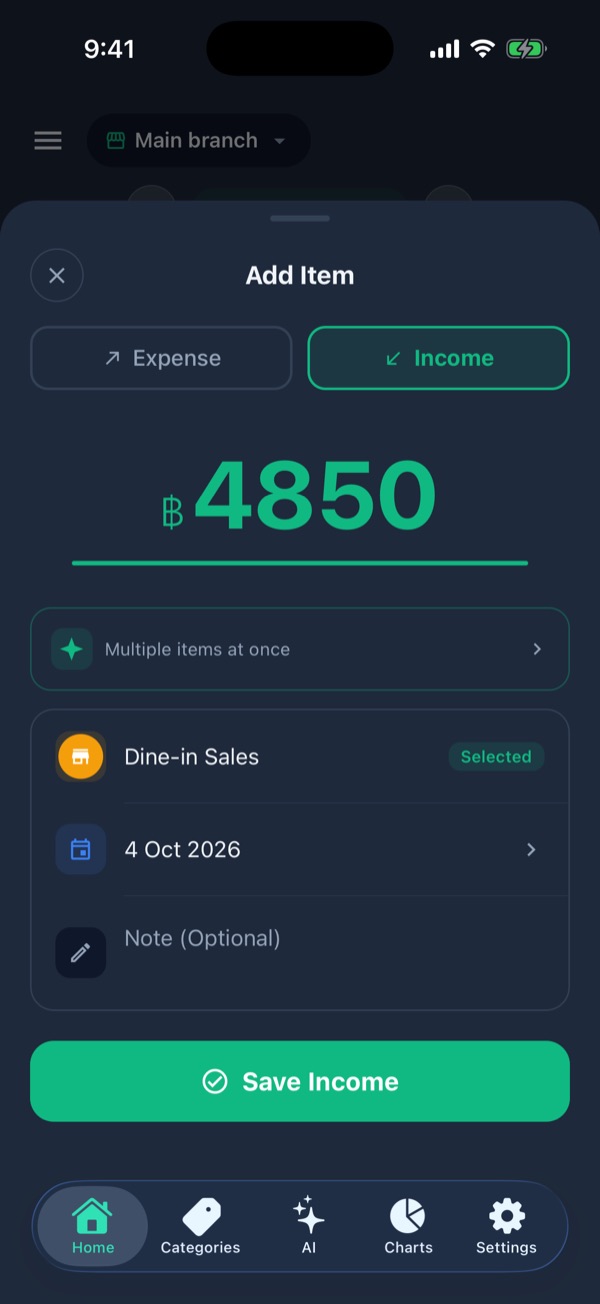
On Home, tap + then Income 1; the amount turns green. Enter the sales amount 2, pick the category for the channel 3 and tap Save Income 4.
Once a day at closing time is enough. Enter each channel's total for the day; there's no need to record every bill.
-
One channel, one category
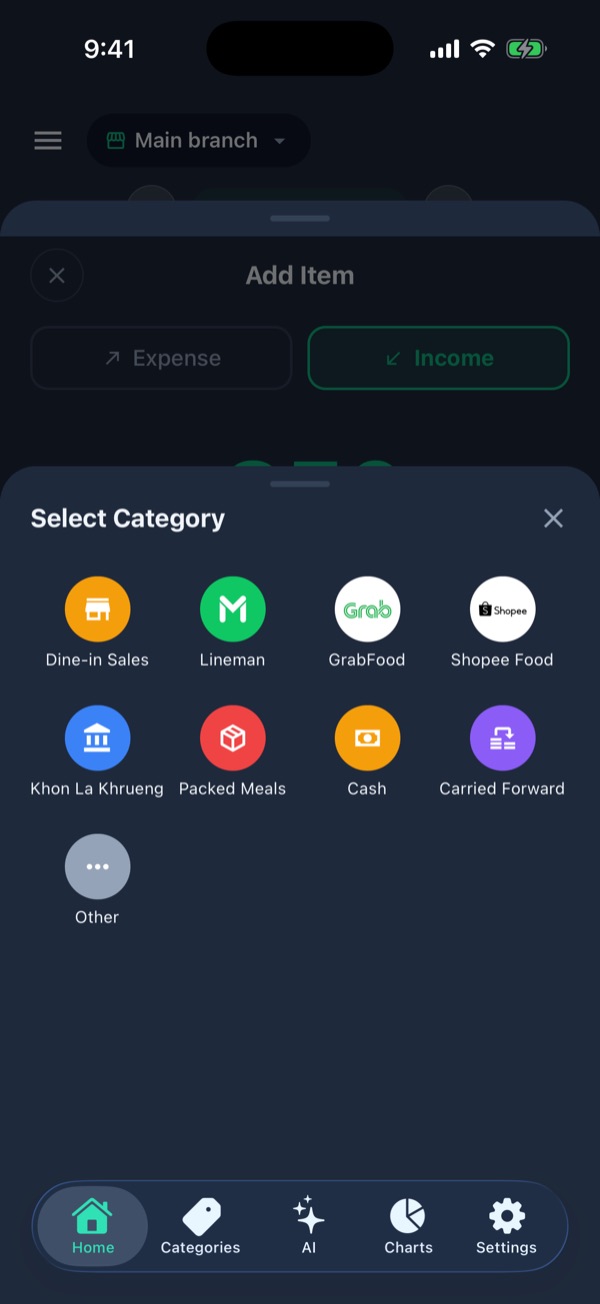
The income categories are already set up 1: Dine-in Sales, Lineman, GrabFood, Shopee Food, plus Khon La Khrueng, Packed Meals, Cash and Carried Forward.
Always record each channel separately; that's how the charts can show which channel really makes money. Sell another way, such as catering? Add your own category on the Categories tab (Guide 1).
-
Faster: type every channel for the AI at once
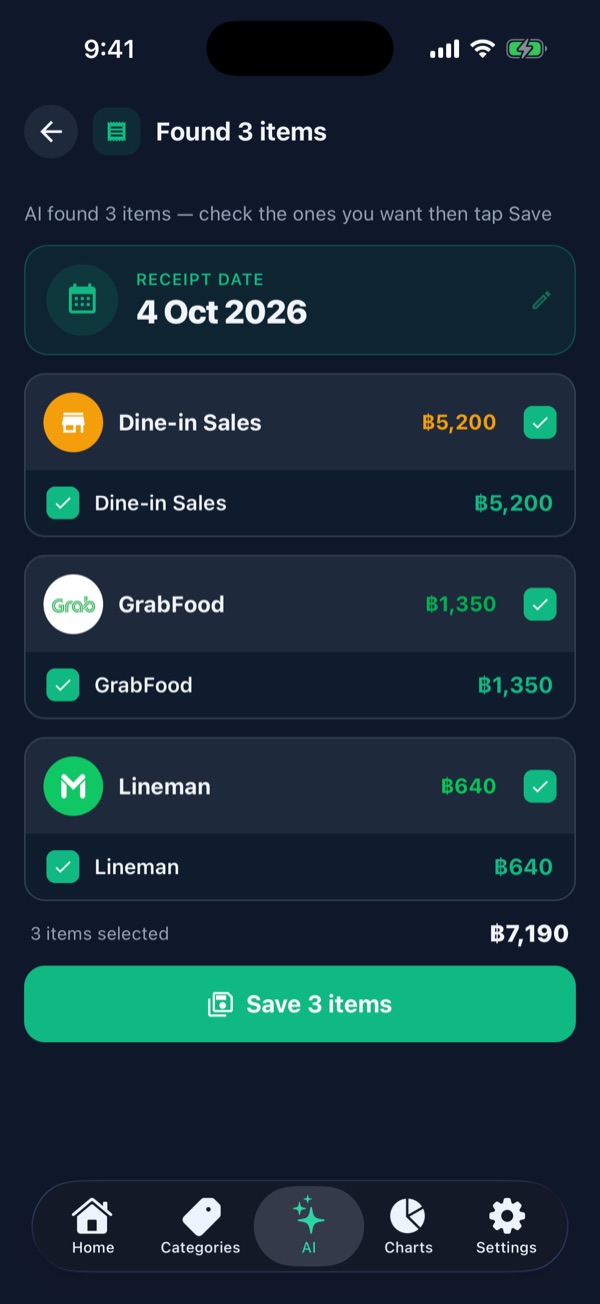
On the AI tab, type all your channels in one message, for example:
dine-in sales 5200, grab 1350, lineman 640
The AI records each as income in its own channel's category 1. Check them and tap Save 3 items 2. That's a single AI use.
Seeing your profit
-
Home shows this month's profit
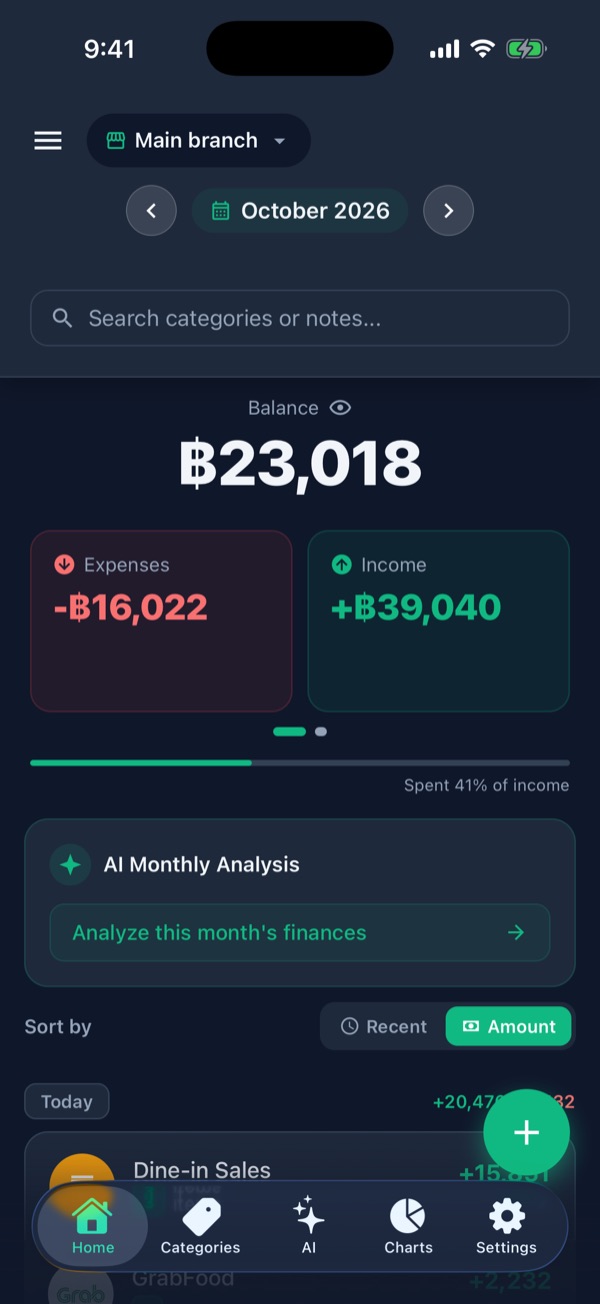
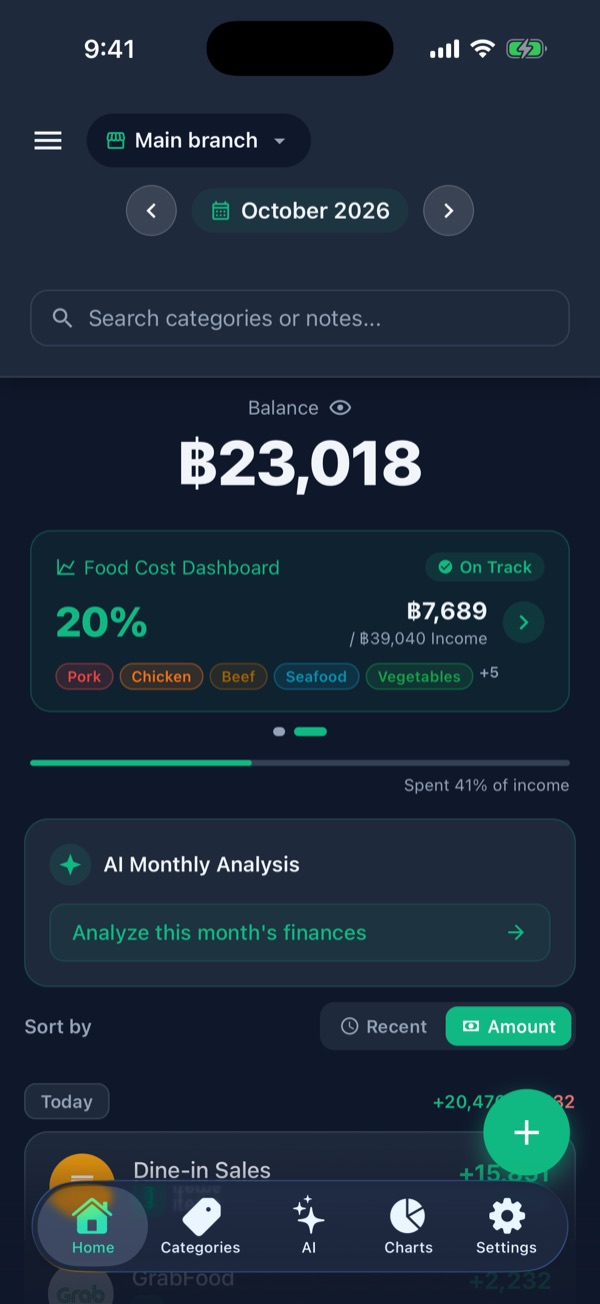
- Balance 1 is this month's income minus expenses, i.e. the month's profit. It turns red when you're losing money. Tap the eye to hide the numbers when someone's looking over your shoulder.
- Income 2 is total sales across every channel.
- Spent % of income 3: the bar turns amber above 60% and red above 85%.
Use the arrows beside the month at the top to look at previous months.
-
Swipe the cards left to see food cost
The Food Cost Dashboard card 1 shows ingredient spending as a % of sales: On Track (under 35%), Watch Out (under 50%), Over Limit (50% or more). Tap it for details.
⚠️ Don't see this card?It only appears once at least one expense category has Count as Cost turned on. Turn it on in the details of Pork, Vegetables, Eggs and so on (how). The month also needs some income recorded.
-
Let the AI sum up the month
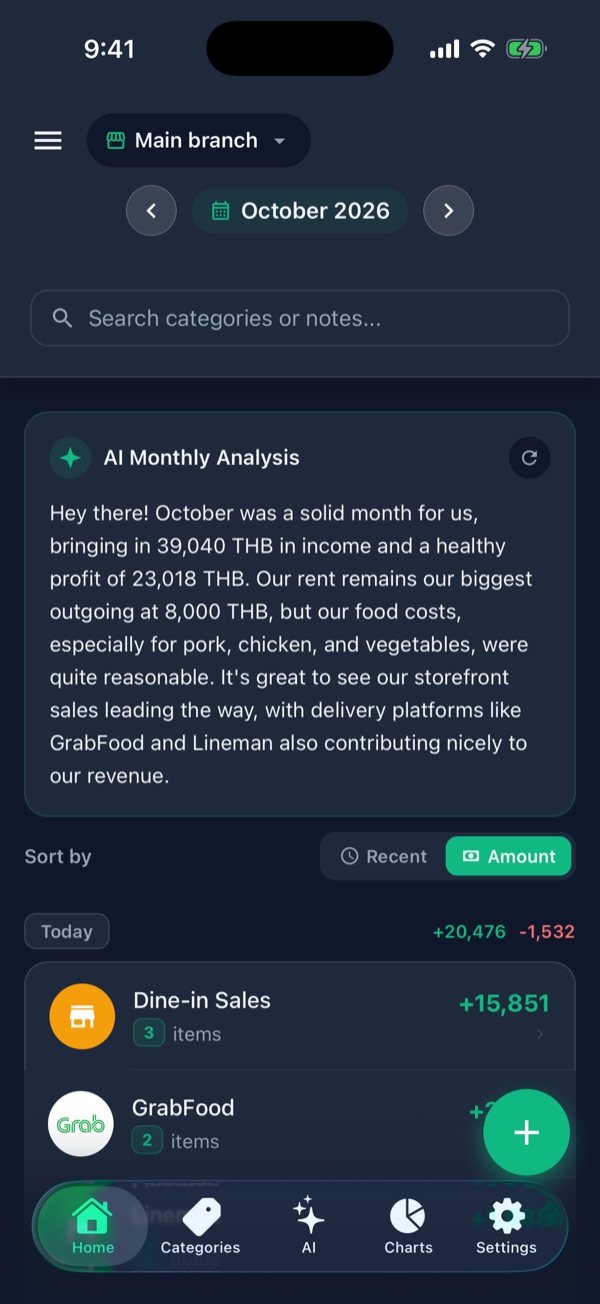
Tap Analyze this month's finances on the AI Monthly Analysis card 1. In a few plain sentences the AI sums up your profit, your biggest costs and your strongest channels. Tap the refresh button 2 to redo it after recording more.
Each summary is one AI use (the free plan includes 10 a month). Running it at the end of the month gets the most out of it.
-
Charts: where the money comes from
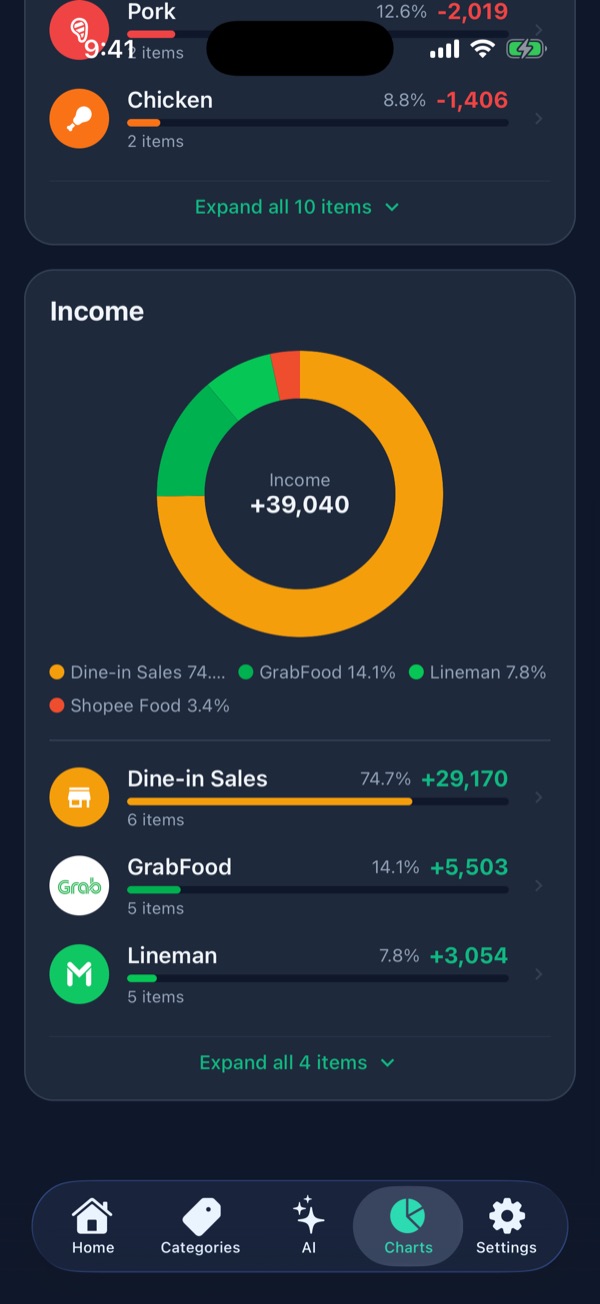
The Charts tab shows an expense donut, and further down an income donut 1. Below it each channel is listed with its % and amount 2; tap one to see every entry.
Want the whole year? Tap the month at the top and choose Yearly.
Reading the numbers
- Profit in the app = what you recorded. Forget to record a supplier bill and your profit looks better than it is. Record everything daily and the numbers become trustworthy.
- Food cost above 35% starts eating into profit. Revisit your portions and prices.
- Delivery channels can bring big sales but high platform fees. Compare what you actually receive with dine-in in the charts to see which channel is worth it.
- Several branches? Home and Charts show one branch at a time. Switch with the branch name button at the top.